

Lista de vídeos
- Dashboards: Grafana, instalación y configuración
- Dashboards: Grafana. Provisioning via filesystem
- Dashboards: Grafana. Provisioning via Grizzly (Grafana API)
- Dashboards: Grafana. Provisioning via Ansible
Descripción
Descubre el poder de Grafana Open Source Software (OSS), la solución ideal para consultar, visualizar y analizar tus métricas, registros y trazas desde cualquier fuente. Con los plugins de fuentes de datos de Grafana, puedes conectarte fácilmente a plataformas como bases de datos de series temporales, incluyendo Grafana Mimir (Prometheus), o herramientas de registros como Grafana Loki. Grafana OSS te permite crear dashboards dinámicos y en tiempo real con gráficos y visualizaciones llenas de información valiosa para monitorear y explorar tus datos de manera eficiente.
Requisitos
sudo useradd grafana -u 472 -g 0 -m -s /bin/false

# assuming install from current path
# cd path_to_install_grafana

mkdir -p etc
mkdir -p lib
touch lib/grafana.db

# ejecutamos Grafana con el fin de extraer los ficheros por defecto
# de /etc/grafana y /var/lib/grafana
docker run -d --name "grafana" grafana/grafana
docker cp grafana:/etc/grafana/. etc
docker cp grafana:/var/lib/grafana/. lib
docker stop grafana
docker rm grafana

sudo chown -R grafana.root *
sudo chmod 640 lib/grafana.db
Al final la estructura de ficheros y directorios quedará así:
.
├── etc
│   ├── grafana.ini
│   ├── ldap.toml
│   └── provisioning
│       ├── access-control
│       ├── alerting
│       ├── dashboards
│       ├── datasources
│       ├── notifiers
│       └── plugins
└── lib
    ├── grafana.db
    └── plugins
Configuración del docker-compose.yml
services:
  grafana:
    container_name:  grafana
    image: grafana/grafana
    restart: unless-stopped
    volumes:
      - /etc/localtime:/etc/localtime:ro
      - ./etc:/etc/grafana
      - ./lib:/var/lib/grafana
    networks:
      - services
networks:
  services:
    external: true
name: servicesVariables para la configuración
.env:GF_SECURITY_SECRET_KEY=The2password.
GF_AUTH_ANONYMOUS_ENABLED=true
GF_AUTH_ANONYMOUS_ORG_ROLE=Admin
GF_USERS_DEFAULT_THEME=dark
GF_LOG_MODE=console
GF_LOG_LEVEL=infoPassword de administrador
docker compose exec grafana grafana-cli admin reset-admin-password The2password.Provisioning
El provisioning se refiere al proceso de automatizar la configuración inicial de Grafana, incluyendo la creación de fuentes de datos, dashboards y ajustes personalizados. Mediante el uso de archivos de configuración predefinidos que se montan en el contenedor de Docker, se logra que Grafana esté listo para su uso desde el inicio, eliminando la necesidad de configuraciones manuales posteriores y asegurando consistencia en diferentes entornos de despliegue.
Existen al menos cuatro formas de aprovisionar configuraciones en Grafana:
- Manual: El usuario exporta e importa los dashboards manualmente entre entornos en ejecución.
- A través del sistema de archivos: Se ajustan los archivos de configuración exportados y se colocan en los directorios correspondientes de aprovisionamiento.
- Mediante la API: Se inyectan los archivos de configuración utilizando la API de Grafana.
- Usando Ansible: Existe una colección de roles para Ansible que permite gestionar Grafana y aprovisionar las configuraciones de forma automatizada.
Estas opciones ofrecen flexibilidad para gestionar y desplegar configuraciones de Grafana en distintos entornos, facilitando la consistencia y eficiencia en el proceso de despliegue.
Estructura de directorios
/etc/grafana/provisioning.
├── grafana.ini
├── ldap.toml
└── provisioning
├── access-control
├── alerting
├── dashboards
├── datasources
├── notifiers
└── pluginsData sources
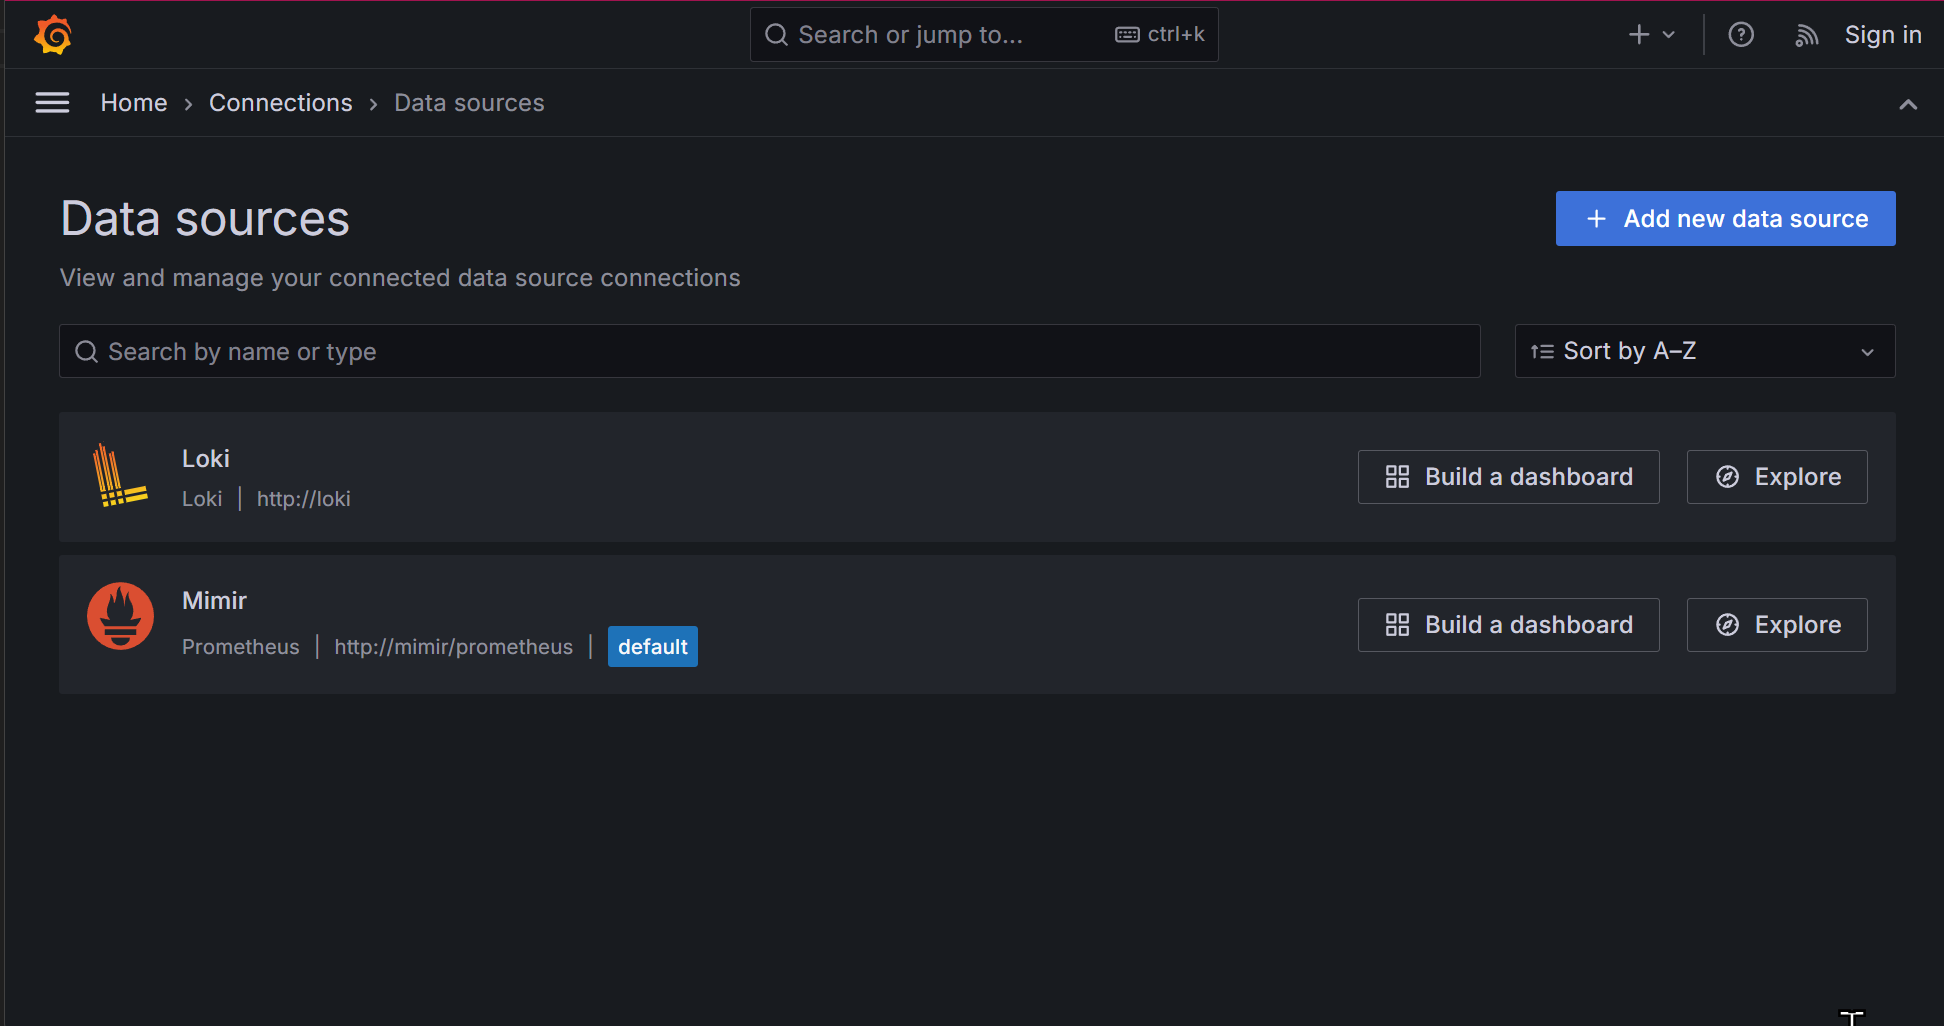
fichero de datasource,
ds.yaml:apiVersion: 1
datasources:
- id: 1
uid: loki01
orgId: 1
name: Loki
type: loki
typeName: Loki
typeLogoUrl: public/app/plugins/datasource/loki/img/loki_icon.svg
access: proxy
url: http://loki
user: ''
database: ''
basicAuth: false
isDefault: true
jsonData:
derivedFields:
- matcherRegex: '[tT]race_?[iI][dD]\"?[:=]\"?(\\w+)'
name: traceID
url: "${__value.raw}"
urlDisplayLabel: ''
readOnly: true
- id: 2
uid: mimir01
orgId: 1
name: Mimir
type: prometheus
typeName: Prometheus
typeLogoUrl: public/app/plugins/datasource/prometheus/img/prometheus_logo.svg
access: proxy
url: http://mimir/prometheus
user: ''
database: ''
basicAuth: false
isDefault: false
jsonData:
exemplarTraceIdDestinations: []
httpMethod: POST
prometheusType: Mimir
prometheusVersion: 2.9.1
readOnly: true
Dashboard
dashboard folders,
default.yaml :apiVersion: 1
providers:
- name: Default
folder: Monitoring
type: file
allowUiUpdates: true
options:
path:
/etc/grafana/provisioning/dashboards 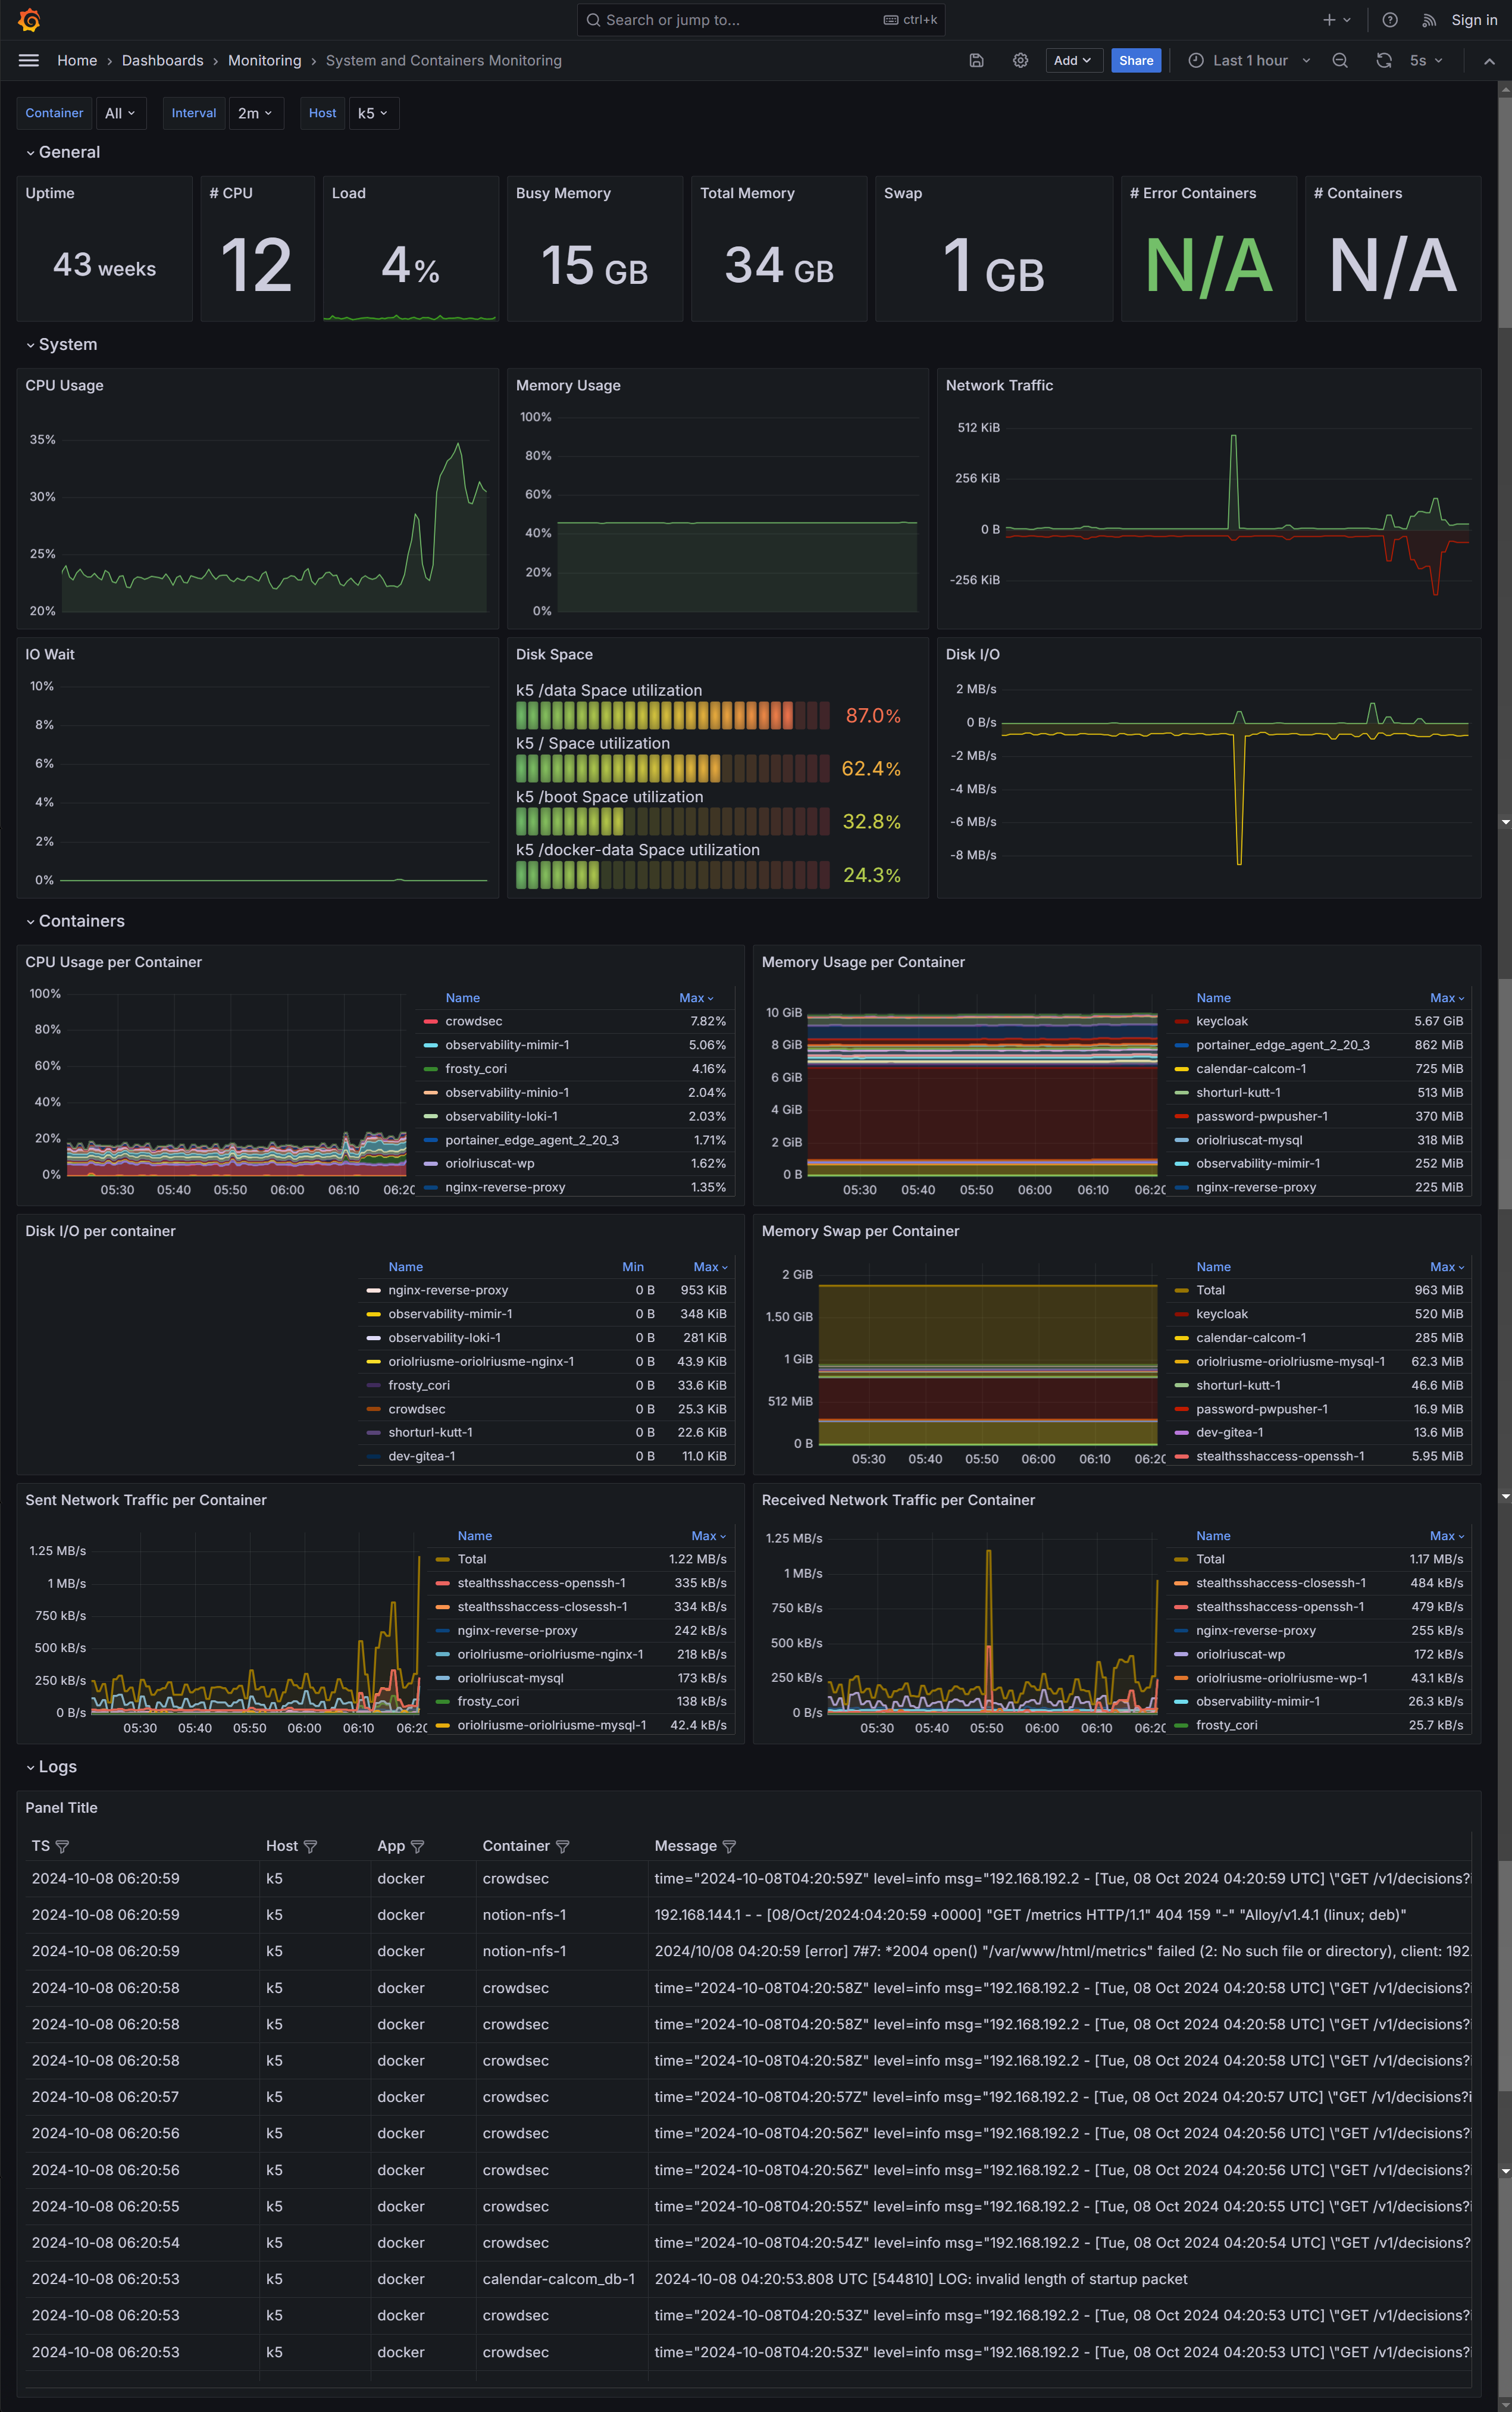
dashboard code, monitoring.json:
{
"__inputs": [
{
"name": "DS_MIMIR",
"label": "MIMIR",
"description": "",
"type": "datasource",
"pluginId": "prometheus",
"pluginName": "Prometheus"
},
{
"name": "DS_LOKI",
"label": "Loki",
"description": "",
"type": "datasource",
"pluginId": "loki",
"pluginName": "Loki"
}
],
"__elements": {},
"__requires": [
{
"type": "panel",
"id": "bargauge",
"name": "Bar gauge",
"version": ""
},
{
"type": "grafana",
"id": "grafana",
"name": "Grafana",
"version": "11.2.0"
},
{
"type": "datasource",
"id": "loki",
"name": "Loki",
"version": "1.0.0"
},
{
"type": "datasource",
"id": "prometheus",
"name": "Prometheus",
"version": "1.0.0"
},
{
"type": "panel",
"id": "stat",
"name": "Stat",
"version": ""
},
{
"type": "panel",
"id": "table",
"name": "Table",
"version": ""
},
{
"type": "panel",
"id": "timeseries",
"name": "Time series",
"version": ""
}
],
"annotations": {
"list": [
{
"builtIn": 1,
"datasource": {
"type": "grafana",
"uid": "-- Grafana --"
},
"enable": true,
"hide": true,
"iconColor": "rgba(0, 211, 255, 1)",
"name": "Annotations & Alerts",
"type": "dashboard"
}
]
},
"description": "A simple overview of the most important Docker host and container metrics. (cAdvisor/Prometheus)",
"editable": true,
"fiscalYearStartMonth": 0,
"gnetId": 893,
"graphTooltip": 1,
"id": null,
"links": [],
"liveNow": false,
"panels": [
{
"collapsed": false,
"gridPos": {
"h": 1,
"w": 24,
"x": 0,
"y": 0
},
"id": 39,
"panels": [],
"title": "General",
"type": "row"
},
{
"datasource": {
"type": "prometheus",
"uid": "mimir01"
},
"fieldConfig": {
"defaults": {
"decimals": 0,
"mappings": [
{
"options": {
"match": "null",
"result": {
"text": "N/A"
}
},
"type": "special"
}
],
"thresholds": {
"mode": "absolute",
"steps": [
{
"color": "green",
"value": null
},
{
"color": "red",
"value": 80
}
]
},
"unit": "s"
},
"overrides": []
},
"gridPos": {
"h": 4,
"w": 3,
"x": 0,
"y": 1
},
"id": 24,
"maxDataPoints": 100,
"options": {
"colorMode": "none",
"graphMode": "none",
"justifyMode": "auto",
"orientation": "horizontal",
"percentChangeColorMode": "standard",
"reduceOptions": {
"calcs": [
"lastNotNull"
],
"fields": "",
"values": false
},
"showPercentChange": false,
"textMode": "auto",
"wideLayout": true
},
"pluginVersion": "11.2.0",
"targets": [
{
"datasource": {
"type": "prometheus",
"uid": "mimir01"
},
"editorMode": "code",
"expr": "time() - node_boot_time_seconds{instance=\"$instance\"}",
"hide": false,
"intervalFactor": 2,
"legendFormat": "",
"range": true,
"refId": "A",
"step": 1800
}
],
"title": "Uptime",
"type": "stat"
},
{
"datasource": {
"type": "prometheus",
"uid": "mimir01"
},
"description": "",
"fieldConfig": {
"defaults": {
"mappings": [
{
"options": {
"match": "null",
"result": {
"text": "N/A"
}
},
"type": "special"
}
],
"thresholds": {
"mode": "absolute",
"steps": [
{
"color": "green",
"value": null
},
{
"color": "red",
"value": 80
}
]
},
"unit": "none"
},
"overrides": []
},
"gridPos": {
"h": 4,
"w": 2,
"x": 3,
"y": 1
},
"id": 43,
"maxDataPoints": 100,
"options": {
"colorMode": "none",
"graphMode": "none",
"justifyMode": "auto",
"orientation": "horizontal",
"percentChangeColorMode": "standard",
"reduceOptions": {
"calcs": [
"lastNotNull"
],
"fields": "",
"values": false
},
"showPercentChange": false,
"textMode": "auto",
"wideLayout": true
},
"pluginVersion": "11.2.0",
"targets": [
{
"datasource": {
"type": "prometheus",
"uid": "mimir01"
},
"disableTextWrap": false,
"editorMode": "builder",
"exemplar": false,
"expr": "count(node_cpu_seconds_total{instance=\"$instance\", mode=\"idle\"})",
"fullMetaSearch": false,
"hide": false,
"includeNullMetadata": true,
"instant": true,
"intervalFactor": 1,
"legendFormat": "__auto",
"range": false,
"refId": "C",
"step": 1800,
"useBackend": false
}
],
"title": "# CPU",
"transformations": [
{
"id": "seriesToRows",
"options": {}
}
],
"type": "stat"
},
{
"datasource": {
"type": "prometheus",
"uid": "mimir01"
},
"fieldConfig": {
"defaults": {
"color": {
"fixedColor": "rgb(69, 193, 31)",
"mode": "fixed"
},
"decimals": 0,
"mappings": [
{
"options": {
"match": "null",
"result": {
"text": "N/A"
}
},
"type": "special"
}
],
"max": 1,
"min": 0,
"thresholds": {
"mode": "absolute",
"steps": [
{
"color": "rgba(245, 54, 54, 0.9)",
"value": null
},
{
"color": "rgba(237, 129, 40, 0.89)",
"value": 0.8
},
{
"color": "rgba(50, 172, 45, 0.97)",
"value": 0.9
}
]
},
"unit": "percentunit"
},
"overrides": []
},
"gridPos": {
"h": 4,
"w": 3,
"x": 5,
"y": 1
},
"id": 27,
"maxDataPoints": 100,
"options": {
"colorMode": "none",
"graphMode": "area",
"justifyMode": "auto",
"orientation": "horizontal",
"percentChangeColorMode": "standard",
"reduceOptions": {
"calcs": [
"mean"
],
"fields": "",
"values": false
},
"showPercentChange": false,
"textMode": "auto",
"wideLayout": true
},
"pluginVersion": "11.2.0",
"targets": [
{
"datasource": {
"type": "prometheus",
"uid": "mimir01"
},
"editorMode": "code",
"expr": "node_load1{instance=~\"$instance.*\"} / count by(job, instance)(count by(job, instance, cpu)(node_cpu_seconds_total{instance=~\"$instance.*\"}))",
"intervalFactor": 2,
"range": true,
"refId": "A",
"step": 1800
}
],
"title": "Load",
"type": "stat"
},
{
"datasource": {
"type": "prometheus",
"uid": "mimir01"
},
"fieldConfig": {
"defaults": {
"decimals": 0,
"mappings": [
{
"options": {
"match": "null",
"result": {
"text": "N/A"
}
},
"type": "special"
}
],
"thresholds": {
"mode": "absolute",
"steps": [
{
"color": "rgba(50, 172, 45, 0.97)",
"value": null
},
{
"color": "rgba(237, 129, 40, 0.89)",
"value": 70
},
{
"color": "rgba(245, 54, 54, 0.9)",
"value": 90
}
]
},
"unit": "decbytes"
},
"overrides": []
},
"gridPos": {
"h": 4,
"w": 3,
"x": 8,
"y": 1
},
"id": 25,
"maxDataPoints": 100,
"options": {
"colorMode": "none",
"graphMode": "none",
"justifyMode": "auto",
"orientation": "horizontal",
"percentChangeColorMode": "standard",
"reduceOptions": {
"calcs": [
"lastNotNull"
],
"fields": "",
"values": false
},
"showPercentChange": false,
"textMode": "auto",
"wideLayout": true
},
"pluginVersion": "11.2.0",
"targets": [
{
"datasource": {
"type": "prometheus",
"uid": "mimir01"
},
"editorMode": "code",
"expr": "(node_memory_MemTotal_bytes{instance=\"$instance\"} - node_memory_MemAvailable_bytes{instance=~\"$instance\"})",
"intervalFactor": 2,
"range": true,
"refId": "A",
"step": 1800
}
],
"title": "Busy Memory",
"type": "stat"
},
{
"datasource": {
"type": "prometheus",
"uid": "mimir01"
},
"fieldConfig": {
"defaults": {
"decimals": 0,
"mappings": [
{
"options": {
"match": "null",
"result": {
"text": "N/A"
}
},
"type": "special"
}
],
"thresholds": {
"mode": "absolute",
"steps": [
{
"color": "rgba(50, 172, 45, 0.97)",
"value": null
},
{
"color": "rgba(237, 129, 40, 0.89)",
"value": 70
},
{
"color": "rgba(245, 54, 54, 0.9)",
"value": 90
}
]
},
"unit": "decbytes"
},
"overrides": []
},
"gridPos": {
"h": 4,
"w": 3,
"x": 11,
"y": 1
},
"id": 45,
"maxDataPoints": 100,
"options": {
"colorMode": "none",
"graphMode": "none",
"justifyMode": "auto",
"orientation": "horizontal",
"percentChangeColorMode": "standard",
"reduceOptions": {
"calcs": [
"lastNotNull"
],
"fields": "",
"values": false
},
"showPercentChange": false,
"textMode": "auto",
"wideLayout": true
},
"pluginVersion": "11.2.0",
"targets": [
{
"datasource": {
"type": "prometheus",
"uid": "mimir01"
},
"editorMode": "code",
"expr": "node_memory_MemTotal_bytes{instance=~\"$instance\"}",
"intervalFactor": 2,
"range": true,
"refId": "A",
"step": 1800
}
],
"title": "Total Memory",
"type": "stat"
},
{
"datasource": {
"type": "prometheus",
"uid": "mimir01"
},
"fieldConfig": {
"defaults": {
"decimals": 0,
"mappings": [
{
"options": {
"match": "null",
"result": {
"text": "N/A"
}
},
"type": "special"
}
],
"max": 500000000,
"min": 0,
"thresholds": {
"mode": "absolute",
"steps": [
{
"color": "rgba(50, 172, 45, 0.97)",
"value": null
},
{
"color": "rgba(237, 129, 40, 0.89)",
"value": 400000000
},
{
"color": "rgba(245, 54, 54, 0.9)"
}
]
},
"unit": "decbytes"
},
"overrides": []
},
"gridPos": {
"h": 4,
"w": 4,
"x": 14,
"y": 1
},
"id": 30,
"maxDataPoints": 100,
"options": {
"colorMode": "none",
"graphMode": "none",
"justifyMode": "auto",
"orientation": "horizontal",
"percentChangeColorMode": "standard",
"reduceOptions": {
"calcs": [
"lastNotNull"
],
"fields": "",
"values": false
},
"showPercentChange": false,
"textMode": "auto",
"wideLayout": true
},
"pluginVersion": "11.2.0",
"targets": [
{
"datasource": {
"type": "prometheus",
"uid": "mimir01"
},
"editorMode": "code",
"expr": "(node_memory_SwapTotal_bytes{instance=~'$instance.*'} - node_memory_SwapFree_bytes{instance=~'$instance.*'})",
"intervalFactor": 2,
"legendFormat": "",
"range": true,
"refId": "A",
"step": 1800
}
],
"title": "Swap",
"type": "stat"
},
{
"datasource": {
"type": "prometheus",
"uid": "mimir01"
},
"description": "",
"fieldConfig": {
"defaults": {
"mappings": [
{
"options": {
"match": "null",
"result": {
"text": "N/A"
}
},
"type": "special"
}
],
"thresholds": {
"mode": "absolute",
"steps": [
{
"color": "green",
"value": null
},
{
"color": "red",
"value": 1
}
]
},
"unit": "none"
},
"overrides": []
},
"gridPos": {
"h": 4,
"w": 3,
"x": 18,
"y": 1
},
"id": 44,
"maxDataPoints": 100,
"options": {
"colorMode": "value",
"graphMode": "none",
"justifyMode": "auto",
"orientation": "horizontal",
"percentChangeColorMode": "standard",
"reduceOptions": {
"calcs": [
"lastNotNull"
],
"fields": "",
"values": false
},
"showPercentChange": false,
"textMode": "value",
"wideLayout": true
},
"pluginVersion": "11.2.0",
"targets": [
{
"datasource": {
"type": "prometheus",
"uid": "mimir01"
},
"disableTextWrap": false,
"editorMode": "code",
"exemplar": false,
"expr": "docker_containers_total{instance=~\"$instance\"} - docker_containers_running_total{instance=~\"$instance\"}",
"fullMetaSearch": false,
"hide": false,
"includeNullMetadata": true,
"instant": true,
"intervalFactor": 1,
"legendFormat": "__auto",
"range": false,
"refId": "C",
"step": 1800,
"useBackend": false
}
],
"title": "# Error Containers",
"type": "stat"
},
{
"datasource": {
"type": "prometheus",
"uid": "mimir01"
},
"description": "",
"fieldConfig": {
"defaults": {
"mappings": [
{
"options": {
"match": "null",
"result": {
"text": "N/A"
}
},
"type": "special"
}
],
"thresholds": {
"mode": "absolute",
"steps": [
{
"color": "green",
"value": null
},
{
"color": "red",
"value": 80
}
]
},
"unit": "none"
},
"overrides": []
},
"gridPos": {
"h": 4,
"w": 3,
"x": 21,
"y": 1
},
"id": 31,
"maxDataPoints": 100,
"options": {
"colorMode": "none",
"graphMode": "none",
"justifyMode": "auto",
"orientation": "horizontal",
"percentChangeColorMode": "standard",
"reduceOptions": {
"calcs": [
"lastNotNull"
],
"fields": "",
"values": false
},
"showPercentChange": false,
"textMode": "auto",
"wideLayout": true
},
"pluginVersion": "11.2.0",
"targets": [
{
"datasource": {
"type": "prometheus",
"uid": "mimir01"
},
"disableTextWrap": false,
"editorMode": "builder",
"exemplar": false,
"expr": "docker_containers_total{instance=\"$instance\"}",
"format": "table",
"fullMetaSearch": false,
"hide": false,
"includeNullMetadata": true,
"instant": true,
"intervalFactor": 1,
"legendFormat": "__auto",
"range": false,
"refId": "C",
"step": 1800,
"useBackend": false
}
],
"title": "# Containers",
"type": "stat"
},
{
"collapsed": false,
"gridPos": {
"h": 1,
"w": 24,
"x": 0,
"y": 5
},
"id": 40,
"panels": [],
"title": "System",
"type": "row"
},
{
"datasource": {
"type": "prometheus",
"uid": "mimir01"
},
"fieldConfig": {
"defaults": {
"color": {
"mode": "palette-classic"
},
"custom": {
"axisBorderShow": false,
"axisCenteredZero": false,
"axisColorMode": "text",
"axisLabel": "",
"axisPlacement": "auto",
"barAlignment": 0,
"barWidthFactor": 0.6,
"drawStyle": "line",
"fillOpacity": 10,
"gradientMode": "none",
"hideFrom": {
"legend": false,
"tooltip": false,
"viz": false
},
"insertNulls": false,
"lineInterpolation": "linear",
"lineWidth": 1,
"pointSize": 5,
"scaleDistribution": {
"type": "linear"
},
"showPoints": "never",
"spanNulls": false,
"stacking": {
"group": "A",
"mode": "normal"
},
"thresholdsStyle": {
"mode": "off"
}
},
"mappings": [],
"thresholds": {
"mode": "absolute",
"steps": [
{
"color": "green",
"value": null
},
{
"color": "red",
"value": 80
}
]
},
"unit": "percent"
},
"overrides": [
{
"matcher": {
"id": "byName",
"options": "{id=\"/\",instance=\"cadvisor:8080\",job=\"prometheus\"}"
},
"properties": [
{
"id": "color",
"value": {
"fixedColor": "#BA43A9",
"mode": "fixed"
}
}
]
},
{
"matcher": {
"id": "byType",
"options": "time"
},
"properties": [
{
"id": "custom.axisPlacement",
"value": "hidden"
}
]
}
]
},
"gridPos": {
"h": 7,
"w": 8,
"x": 0,
"y": 6
},
"id": 5,
"options": {
"legend": {
"calcs": [],
"displayMode": "list",
"placement": "bottom",
"showLegend": false
},
"tooltip": {
"maxHeight": 600,
"mode": "multi",
"sort": "none"
}
},
"targets": [
{
"datasource": {
"type": "prometheus",
"uid": "mimir01"
},
"expr": "sum(rate(container_cpu_system_seconds_total[1m]))",
"hide": true,
"intervalFactor": 2,
"legendFormat": "a",
"refId": "B",
"step": 120
},
{
"datasource": {
"type": "prometheus",
"uid": "mimir01"
},
"expr": "sum(rate(container_cpu_system_seconds_total{name=~\".+\"}[1m]))",
"hide": true,
"interval": "",
"intervalFactor": 2,
"legendFormat": "nur container",
"refId": "F",
"step": 10
},
{
"datasource": {
"type": "prometheus",
"uid": "mimir01"
},
"expr": "sum(rate(container_cpu_system_seconds_total{id=\"/\"}[1m]))",
"hide": true,
"interval": "",
"intervalFactor": 2,
"legendFormat": "nur docker host",
"metric": "",
"refId": "A",
"step": 20
},
{
"datasource": {
"type": "prometheus",
"uid": "mimir01"
},
"expr": "sum(rate(process_cpu_seconds_total[$interval])) * 100",
"hide": false,
"interval": "",
"intervalFactor": 2,
"legendFormat": "host",
"metric": "",
"refId": "C",
"step": 600
},
{
"datasource": {
"type": "prometheus",
"uid": "mimir01"
},
"expr": "sum(rate(container_cpu_system_seconds_total{name=~\".+\"}[1m])) + sum(rate(container_cpu_system_seconds_total{id=\"/\"}[1m])) + sum(rate(process_cpu_seconds_total[1m]))",
"hide": true,
"intervalFactor": 2,
"legendFormat": "",
"refId": "D",
"step": 120
}
],
"title": "CPU Usage",
"type": "timeseries"
},
{
"datasource": {
"type": "prometheus",
"uid": "mimir01"
},
"fieldConfig": {
"defaults": {
"color": {
"mode": "palette-classic"
},
"custom": {
"axisBorderShow": false,
"axisCenteredZero": false,
"axisColorMode": "text",
"axisLabel": "",
"axisPlacement": "auto",
"barAlignment": 0,
"barWidthFactor": 0.6,
"drawStyle": "line",
"fillOpacity": 10,
"gradientMode": "none",
"hideFrom": {
"legend": false,
"tooltip": false,
"viz": false
},
"insertNulls": false,
"lineInterpolation": "linear",
"lineWidth": 1,
"pointSize": 5,
"scaleDistribution": {
"type": "linear"
},
"showPoints": "never",
"spanNulls": false,
"stacking": {
"group": "A",
"mode": "normal"
},
"thresholdsStyle": {
"mode": "off"
}
},
"mappings": [],
"max": 100,
"min": 0,
"thresholds": {
"mode": "absolute",
"steps": [
{
"color": "green",
"value": null
},
{
"color": "red",
"value": 80
}
]
},
"unit": "percent"
},
"overrides": [
{
"matcher": {
"id": "byName",
"options": "{id=\"/\",instance=\"cadvisor:8080\",job=\"prometheus\"}"
},
"properties": [
{
"id": "color",
"value": {
"fixedColor": "#BA43A9",
"mode": "fixed"
}
}
]
},
{
"matcher": {
"id": "byType",
"options": "time"
},
"properties": [
{
"id": "custom.axisPlacement",
"value": "hidden"
}
]
}
]
},
"gridPos": {
"h": 7,
"w": 7,
"x": 8,
"y": 6
},
"id": 41,
"options": {
"legend": {
"calcs": [],
"displayMode": "list",
"placement": "bottom",
"showLegend": false
},
"tooltip": {
"maxHeight": 600,
"mode": "multi",
"sort": "none"
}
},
"targets": [
{
"datasource": {
"type": "prometheus",
"uid": "mimir01"
},
"disableTextWrap": false,
"editorMode": "code",
"expr": "((node_memory_MemTotal_bytes{instance=\"$instance\"} - node_memory_MemAvailable_bytes{instance=~\"$instance\"}) / node_memory_MemTotal_bytes{instance=~\"$instance\"}) * 100 ",
"fullMetaSearch": false,
"hide": false,
"includeNullMetadata": true,
"interval": "",
"intervalFactor": 2,
"legendFormat": "__auto",
"metric": "",
"range": true,
"refId": "C",
"step": 600,
"useBackend": false
}
],
"title": "Memory Usage",
"type": "timeseries"
},
{
"datasource": {
"type": "prometheus",
"uid": "mimir01"
},
"fieldConfig": {
"defaults": {
"color": {
"mode": "palette-classic"
},
"custom": {
"axisBorderShow": false,
"axisCenteredZero": false,
"axisColorMode": "text",
"axisLabel": "",
"axisPlacement": "auto",
"barAlignment": 0,
"barWidthFactor": 0.6,
"drawStyle": "line",
"fillOpacity": 10,
"gradientMode": "none",
"hideFrom": {
"legend": false,
"tooltip": false,
"viz": false
},
"insertNulls": false,
"lineInterpolation": "linear",
"lineWidth": 1,
"pointSize": 5,
"scaleDistribution": {
"type": "linear"
},
"showPoints": "never",
"spanNulls": false,
"stacking": {
"group": "A",
"mode": "none"
},
"thresholdsStyle": {
"mode": "off"
}
},
"mappings": [],
"thresholds": {
"mode": "absolute",
"steps": [
{
"color": "green",
"value": null
},
{
"color": "red",
"value": 80
}
]
},
"unit": "bytes"
},
"overrides": [
{
"matcher": {
"id": "byName",
"options": "SENT"
},
"properties": [
{
"id": "color",
"value": {
"fixedColor": "#BF1B00",
"mode": "fixed"
}
}
]
},
{
"matcher": {
"id": "byType",
"options": "time"
},
"properties": [
{
"id": "custom.axisPlacement",
"value": "hidden"
}
]
}
]
},
"gridPos": {
"h": 7,
"w": 9,
"x": 15,
"y": 6
},
"id": 19,
"options": {
"legend": {
"calcs": [],
"displayMode": "list",
"placement": "bottom",
"showLegend": false
},
"tooltip": {
"maxHeight": 600,
"mode": "multi",
"sort": "none"
}
},
"targets": [
{
"datasource": {
"type": "prometheus",
"uid": "mimir01"
},
"expr": "sum(rate(container_network_receive_bytes_total{id=\"/\"}[$interval])) by (id)",
"intervalFactor": 2,
"legendFormat": "RECEIVED",
"refId": "A",
"step": 600
},
{
"datasource": {
"type": "prometheus",
"uid": "mimir01"
},
"expr": "- sum(rate(container_network_transmit_bytes_total{id=\"/\"}[$interval])) by (id)",
"hide": false,
"intervalFactor": 2,
"legendFormat": "SENT",
"refId": "B",
"step": 600
}
],
"title": "Network Traffic",
"type": "timeseries"
},
{
"datasource": {
"type": "prometheus",
"uid": "mimir01"
},
"fieldConfig": {
"defaults": {
"color": {
"mode": "palette-classic"
},
"custom": {
"axisBorderShow": false,
"axisCenteredZero": false,
"axisColorMode": "text",
"axisLabel": "",
"axisPlacement": "auto",
"barAlignment": 0,
"barWidthFactor": 0.6,
"drawStyle": "line",
"fillOpacity": 10,
"gradientMode": "none",
"hideFrom": {
"legend": false,
"tooltip": false,
"viz": false
},
"insertNulls": false,
"lineInterpolation": "linear",
"lineWidth": 1,
"pointSize": 5,
"scaleDistribution": {
"type": "linear"
},
"showPoints": "never",
"spanNulls": false,
"stacking": {
"group": "A",
"mode": "normal"
},
"thresholdsStyle": {
"mode": "off"
}
},
"mappings": [],
"max": 10,
"min": 0,
"thresholds": {
"mode": "absolute",
"steps": [
{
"color": "green",
"value": null
},
{
"color": "red",
"value": 80
}
]
},
"unit": "percent"
},
"overrides": [
{
"matcher": {
"id": "byName",
"options": "{id=\"/\",instance=\"cadvisor:8080\",job=\"prometheus\"}"
},
"properties": [
{
"id": "color",
"value": {
"fixedColor": "#BA43A9",
"mode": "fixed"
}
}
]
},
{
"matcher": {
"id": "byType",
"options": "time"
},
"properties": [
{
"id": "custom.axisPlacement",
"value": "hidden"
}
]
}
]
},
"gridPos": {
"h": 7,
"w": 8,
"x": 0,
"y": 13
},
"id": 42,
"options": {
"legend": {
"calcs": [],
"displayMode": "list",
"placement": "bottom",
"showLegend": false
},
"tooltip": {
"maxHeight": 600,
"mode": "multi",
"sort": "none"
}
},
"targets": [
{
"datasource": {
"type": "prometheus",
"uid": "mimir01"
},
"editorMode": "code",
"expr": "sum(rate(node_pressure_io_waiting_seconds_total[$interval])) * 100",
"hide": false,
"interval": "",
"intervalFactor": 2,
"legendFormat": "host",
"metric": "",
"range": true,
"refId": "C",
"step": 600
}
],
"title": "IO Wait",
"type": "timeseries"
},
{
"datasource": {
"type": "prometheus",
"uid": "mimir01"
},
"description": "",
"fieldConfig": {
"defaults": {
"color": {
"mode": "continuous-GrYlRd"
},
"mappings": [],
"max": 100,
"min": 0,
"thresholds": {
"mode": "absolute",
"steps": [
{
"color": "green",
"value": null
}
]
},
"unit": "percent"
},
"overrides": []
},
"gridPos": {
"h": 7,
"w": 7,
"x": 8,
"y": 13
},
"id": 2,
"options": {
"displayMode": "lcd",
"maxVizHeight": 300,
"minVizHeight": 10,
"minVizWidth": 0,
"namePlacement": "auto",
"orientation": "horizontal",
"reduceOptions": {
"calcs": [
"lastNotNull"
],
"fields": "",
"values": false
},
"showUnfilled": true,
"sizing": "auto",
"text": {},
"valueMode": "color"
},
"pluginVersion": "11.2.0",
"targets": [
{
"datasource": {
"type": "prometheus",
"uid": "mimir01"
},
"editorMode": "code",
"exemplar": true,
"expr": "topk(40, (100 - (windows_logical_disk_free_bytes{volume!~\"HarddiskVolume.*\",instance=\"$instance\"} / windows_logical_disk_size_bytes)*100 \r\nor \r\n100 - ((node_filesystem_avail_bytes{device!~'rootfs',mountpoint!~'/mnt|/media|/run.*|/boot/efi',instance=\"$instance\"} * 100) / node_filesystem_size_bytes{device!~'rootfs',mountpoint!~'/run.*|/boot/efi|/snap.*',instance=\"$instance\"}) ) )\r\n",
"format": "time_series",
"instant": true,
"interval": "",
"intervalFactor": 1,
"legendFormat": "{{desc}} {{instance}} {{volume}} {{mountpoint}} Space utilization",
"refId": "A"
}
],
"title": "Disk Space",
"transformations": [
{
"id": "filterFieldsByName",
"options": {
"include": {}
}
}
],
"type": "bargauge"
},
{
"datasource": {
"type": "prometheus",
"uid": "mimir01"
},
"fieldConfig": {
"defaults": {
"color": {
"mode": "palette-classic"
},
"custom": {
"axisBorderShow": false,
"axisCenteredZero": false,
"axisColorMode": "text",
"axisLabel": "",
"axisPlacement": "auto",
"barAlignment": 0,
"barWidthFactor": 0.6,
"drawStyle": "line",
"fillOpacity": 10,
"gradientMode": "none",
"hideFrom": {
"legend": false,
"tooltip": false,
"viz": false
},
"insertNulls": false,
"lineInterpolation": "linear",
"lineWidth": 1,
"pointSize": 5,
"scaleDistribution": {
"type": "linear"
},
"showPoints": "never",
"spanNulls": false,
"stacking": {
"group": "A",
"mode": "none"
},
"thresholdsStyle": {
"mode": "off"
}
},
"mappings": [],
"thresholds": {
"mode": "absolute",
"steps": [
{
"color": "green",
"value": null
},
{
"color": "red",
"value": 80
}
]
},
"unit": "Bps"
},
"overrides": [
{
"matcher": {
"id": "byName",
"options": "IN on /sda"
},
"properties": [
{
"id": "color",
"value": {
"fixedColor": "#7EB26D",
"mode": "fixed"
}
}
]
},
{
"matcher": {
"id": "byName",
"options": "OUT on /sda"
},
"properties": [
{
"id": "color",
"value": {
"fixedColor": "#890F02",
"mode": "fixed"
}
}
]
},
{
"matcher": {
"id": "byType",
"options": "time"
},
"properties": [
{
"id": "custom.axisPlacement",
"value": "hidden"
}
]
}
]
},
"gridPos": {
"h": 7,
"w": 9,
"x": 15,
"y": 13
},
"id": 3,
"options": {
"legend": {
"calcs": [],
"displayMode": "list",
"placement": "bottom",
"showLegend": false
},
"tooltip": {
"maxHeight": 600,
"mode": "multi",
"sort": "none"
}
},
"targets": [
{
"datasource": {
"type": "prometheus",
"uid": "mimir01"
},
"editorMode": "code",
"expr": "sum(rate(node_disk_read_bytes_total{instance=~\"$instance\"}[$interval])) by (name)",
"hide": false,
"intervalFactor": 2,
"legendFormat": "Read on /{{device}}",
"metric": "node_disk_bytes_read",
"range": true,
"refId": "A",
"step": 600
},
{
"datasource": {
"type": "prometheus",
"uid": "mimir01"
},
"editorMode": "code",
"expr": "-sum(rate(node_disk_written_bytes_total{instance=~\"$instance\"}[$interval])) by (name)",
"hide": false,
"intervalFactor": 2,
"legendFormat": "Write on /{{device}}",
"metric": "",
"range": true,
"refId": "B",
"step": 600
}
],
"title": "Disk I/O",
"type": "timeseries"
},
{
"collapsed": false,
"gridPos": {
"h": 1,
"w": 24,
"x": 0,
"y": 20
},
"id": 38,
"panels": [],
"title": "Containers",
"type": "row"
},
{
"datasource": {
"type": "prometheus",
"uid": "mimir01"
},
"fieldConfig": {
"defaults": {
"color": {
"mode": "palette-classic"
},
"custom": {
"axisCenteredZero": false,
"axisColorMode": "text",
"axisLabel": "",
"axisPlacement": "auto",
"barAlignment": 0,
"drawStyle": "line",
"fillOpacity": 50,
"gradientMode": "none",
"hideFrom": {
"legend": false,
"tooltip": false,
"viz": false
},
"insertNulls": false,
"lineInterpolation": "linear",
"lineStyle": {
"fill": "solid"
},
"lineWidth": 1,
"pointSize": 5,
"scaleDistribution": {
"type": "linear"
},
"showPoints": "never",
"spanNulls": false,
"stacking": {
"group": "A",
"mode": "normal"
},
"thresholdsStyle": {
"mode": "off"
}
},
"mappings": [],
"max": 100,
"min": 0,
"thresholds": {
"mode": "absolute",
"steps": [
{
"color": "green"
},
{
"color": "red",
"value": 80
}
]
},
"unit": "percent"
},
"overrides": []
},
"gridPos": {
"h": 7,
"w": 12,
"x": 0,
"y": 21
},
"id": 1,
"options": {
"legend": {
"calcs": [
"max"
],
"displayMode": "table",
"placement": "right",
"showLegend": true,
"sortBy": "Max",
"sortDesc": true
},
"tooltip": {
"maxHeight": 600,
"mode": "multi",
"sort": "none"
}
},
"targets": [
{
"datasource": {
"type": "prometheus",
"uid": "mimir01"
},
"editorMode": "code",
"expr": "sum(rate(container_cpu_usage_seconds_total{name=~\"$container_name\",instance=~\"$instance\"}[$interval])) by (name) * 100",
"hide": false,
"interval": "",
"intervalFactor": 2,
"legendFormat": "{{name}}",
"metric": "",
"range": true,
"refId": "F",
"step": 240
},
{
"datasource": {
"type": "prometheus",
"uid": "mimir01"
},
"editorMode": "code",
"expr": "sum(rate(container_cpu_usage_seconds_total{name=~\".+\",instance=~\"$instance\"}[$interval])) * 100",
"hide": true,
"interval": "",
"intervalFactor": 2,
"legendFormat": "Total",
"metric": "",
"range": true,
"refId": "A",
"step": 240
}
],
"title": "CPU Usage per Container",
"type": "timeseries"
},
{
"datasource": {
"type": "prometheus",
"uid": "mimir01"
},
"fieldConfig": {
"defaults": {
"color": {
"mode": "palette-classic"
},
"custom": {
"axisCenteredZero": false,
"axisColorMode": "text",
"axisLabel": "",
"axisPlacement": "auto",
"barAlignment": 0,
"drawStyle": "line",
"fillOpacity": 30,
"gradientMode": "none",
"hideFrom": {
"legend": false,
"tooltip": false,
"viz": false
},
"insertNulls": false,
"lineInterpolation": "linear",
"lineWidth": 2,
"pointSize": 5,
"scaleDistribution": {
"type": "linear"
},
"showPoints": "never",
"spanNulls": false,
"stacking": {
"group": "A",
"mode": "normal"
},
"thresholdsStyle": {
"mode": "off"
}
},
"mappings": [],
"thresholds": {
"mode": "absolute",
"steps": [
{
"color": "green"
},
{
"color": "red",
"value": 80
}
]
},
"unit": "bytes"
},
"overrides": []
},
"gridPos": {
"h": 7,
"w": 12,
"x": 12,
"y": 21
},
"id": 10,
"options": {
"legend": {
"calcs": [
"max"
],
"displayMode": "table",
"placement": "right",
"showLegend": true,
"sortBy": "Max",
"sortDesc": true
},
"tooltip": {
"maxHeight": 600,
"mode": "multi",
"sort": "none"
}
},
"targets": [
{
"datasource": {
"type": "prometheus",
"uid": "mimir01"
},
"editorMode": "code",
"expr": "sum(container_memory_rss{name=~\"$container_name\",instance=\"$instance\"}) by (name)",
"hide": false,
"intervalFactor": 2,
"legendFormat": "{{name}}",
"range": true,
"refId": "A",
"step": 240
},
{
"datasource": {
"type": "prometheus",
"uid": "mimir01"
},
"editorMode": "code",
"exemplar": false,
"expr": "sum(container_memory_rss{name=~\".*\",instance=~\"$instance\"})",
"hide": true,
"instant": false,
"intervalFactor": 2,
"legendFormat": "Total",
"range": true,
"refId": "B",
"step": 240
}
],
"title": "Memory Usage per Container",
"type": "timeseries"
},
{
"datasource": {
"type": "prometheus",
"uid": "mimir01"
},
"description": "",
"fieldConfig": {
"defaults": {
"color": {
"mode": "palette-classic"
},
"custom": {
"axisCenteredZero": false,
"axisColorMode": "text",
"axisLabel": "",
"axisPlacement": "auto",
"barAlignment": 0,
"drawStyle": "line",
"fillOpacity": 30,
"gradientMode": "none",
"hideFrom": {
"legend": false,
"tooltip": false,
"viz": false
},
"insertNulls": false,
"lineInterpolation": "linear",
"lineWidth": 2,
"pointSize": 5,
"scaleDistribution": {
"type": "linear"
},
"showPoints": "never",
"spanNulls": false,
"stacking": {
"group": "A",
"mode": "normal"
},
"thresholdsStyle": {
"mode": "off"
}
},
"mappings": [],
"thresholds": {
"mode": "absolute",
"steps": [
{
"color": "green"
},
{
"color": "red",
"value": 80
}
]
},
"unit": "bytes"
},
"overrides": []
},
"gridPos": {
"h": 7,
"w": 12,
"x": 0,
"y": 28
},
"id": 48,
"options": {
"legend": {
"calcs": [
"min",
"max"
],
"displayMode": "table",
"placement": "right",
"showLegend": true,
"sortBy": "Max",
"sortDesc": true
},
"tooltip": {
"maxHeight": 600,
"mode": "multi",
"sort": "none"
}
},
"targets": [
{
"datasource": {
"type": "prometheus",
"uid": "mimir01"
},
"editorMode": "code",
"exemplar": false,
"expr": "-sum(rate(container_fs_writes_bytes_total{name=~\"$container_name\",instance=~\"$instance\"}[$interval])) by (name)",
"hide": false,
"instant": false,
"intervalFactor": 2,
"legendFormat": "{{label_name}}",
"range": true,
"refId": "B",
"step": 240
},
{
"datasource": {
"type": "prometheus",
"uid": "mimir01"
},
"disableTextWrap": false,
"editorMode": "code",
"expr": "sum(rate(container_fs_reads_bytes_total{name=~\"$container_name\",instance=~\"$instance\"}[$interval])) by (name)",
"fullMetaSearch": false,
"hide": false,
"includeNullMetadata": true,
"intervalFactor": 2,
"legendFormat": "{{name}}",
"range": true,
"refId": "A",
"step": 240,
"useBackend": false
}
],
"title": "Disk I/O per container",
"transformations": [
{
"id": "organize",
"options": {}
}
],
"type": "timeseries"
},
{
"datasource": {
"type": "prometheus",
"uid": "mimir01"
},
"fieldConfig": {
"defaults": {
"color": {
"mode": "palette-classic"
},
"custom": {
"axisCenteredZero": false,
"axisColorMode": "text",
"axisLabel": "",
"axisPlacement": "auto",
"barAlignment": 0,
"drawStyle": "line",
"fillOpacity": 30,
"gradientMode": "none",
"hideFrom": {
"legend": false,
"tooltip": false,
"viz": false
},
"insertNulls": false,
"lineInterpolation": "linear",
"lineWidth": 2,
"pointSize": 5,
"scaleDistribution": {
"type": "linear"
},
"showPoints": "never",
"spanNulls": false,
"stacking": {
"group": "A",
"mode": "normal"
},
"thresholdsStyle": {
"mode": "off"
}
},
"mappings": [],
"thresholds": {
"mode": "absolute",
"steps": [
{
"color": "green"
},
{
"color": "red",
"value": 80
}
]
},
"unit": "bytes"
},
"overrides": []
},
"gridPos": {
"h": 7,
"w": 12,
"x": 12,
"y": 28
},
"id": 34,
"options": {
"legend": {
"calcs": [
"max"
],
"displayMode": "table",
"placement": "right",
"showLegend": true,
"sortBy": "Max",
"sortDesc": true
},
"tooltip": {
"maxHeight": 600,
"mode": "multi",
"sort": "none"
}
},
"targets": [
{
"datasource": {
"type": "prometheus",
"uid": "mimir01"
},
"editorMode": "code",
"expr": "sum(container_memory_swap{name=~\"$container_name\",instance=\"$instance\"}) by (name)",
"hide": false,
"intervalFactor": 2,
"legendFormat": "{{name}}",
"range": true,
"refId": "A",
"step": 240
},
{
"datasource": {
"type": "prometheus",
"uid": "mimir01"
},
"editorMode": "code",
"expr": "sum(container_memory_swap{name=~\".+\",instance=\"$instance\"}) ",
"hide": false,
"intervalFactor": 2,
"legendFormat": "Total",
"range": true,
"refId": "B",
"step": 240
}
],
"title": "Memory Swap per Container",
"type": "timeseries"
},
{
"datasource": {
"type": "prometheus",
"uid": "mimir01"
},
"fieldConfig": {
"defaults": {
"color": {
"mode": "palette-classic"
},
"custom": {
"axisCenteredZero": false,
"axisColorMode": "text",
"axisLabel": "",
"axisPlacement": "auto",
"barAlignment": 0,
"drawStyle": "line",
"fillOpacity": 10,
"gradientMode": "none",
"hideFrom": {
"legend": false,
"tooltip": false,
"viz": false
},
"insertNulls": false,
"lineInterpolation": "linear",
"lineWidth": 2,
"pointSize": 5,
"scaleDistribution": {
"type": "linear"
},
"showPoints": "never",
"spanNulls": false,
"stacking": {
"group": "A",
"mode": "none"
},
"thresholdsStyle": {
"mode": "off"
}
},
"mappings": [],
"thresholds": {
"mode": "absolute",
"steps": [
{
"color": "green"
},
{
"color": "red",
"value": 80
}
]
},
"unit": "Bps"
},
"overrides": []
},
"gridPos": {
"h": 7,
"w": 12,
"x": 0,
"y": 35
},
"id": 9,
"options": {
"legend": {
"calcs": [
"max"
],
"displayMode": "table",
"placement": "right",
"showLegend": true,
"sortBy": "Max",
"sortDesc": true
},
"tooltip": {
"maxHeight": 600,
"mode": "multi",
"sort": "none"
}
},
"targets": [
{
"datasource": {
"type": "prometheus",
"uid": "mimir01"
},
"editorMode": "code",
"expr": "sum(rate(container_network_transmit_bytes_total{name=~\"$container_name\"}[$interval])) by (name)",
"intervalFactor": 2,
"legendFormat": "__auto",
"range": true,
"refId": "A",
"step": 240
},
{
"datasource": {
"type": "prometheus",
"uid": "mimir01"
},
"editorMode": "code",
"expr": "sum(rate(container_network_transmit_bytes_total{name=~\".+\"}[$interval])) ",
"hide": false,
"intervalFactor": 2,
"legendFormat": "Total",
"range": true,
"refId": "B",
"step": 10
}
],
"title": "Sent Network Traffic per Container",
"type": "timeseries"
},
{
"datasource": {
"type": "prometheus",
"uid": "mimir01"
},
"fieldConfig": {
"defaults": {
"color": {
"mode": "palette-classic"
},
"custom": {
"axisCenteredZero": false,
"axisColorMode": "text",
"axisLabel": "",
"axisPlacement": "auto",
"barAlignment": 0,
"drawStyle": "line",
"fillOpacity": 10,
"gradientMode": "none",
"hideFrom": {
"legend": false,
"tooltip": false,
"viz": false
},
"insertNulls": false,
"lineInterpolation": "linear",
"lineWidth": 2,
"pointSize": 5,
"scaleDistribution": {
"type": "linear"
},
"showPoints": "never",
"spanNulls": false,
"stacking": {
"group": "A",
"mode": "none"
},
"thresholdsStyle": {
"mode": "off"
}
},
"mappings": [],
"thresholds": {
"mode": "absolute",
"steps": [
{
"color": "green"
},
{
"color": "red",
"value": 80
}
]
},
"unit": "Bps"
},
"overrides": []
},
"gridPos": {
"h": 7,
"w": 12,
"x": 12,
"y": 35
},
"id": 8,
"options": {
"legend": {
"calcs": [
"max"
],
"displayMode": "table",
"placement": "right",
"showLegend": true,
"sortBy": "Max",
"sortDesc": true
},
"tooltip": {
"maxHeight": 600,
"mode": "multi",
"sort": "none"
}
},
"targets": [
{
"datasource": {
"type": "prometheus",
"uid": "mimir01"
},
"editorMode": "code",
"expr": "sum(rate(container_network_receive_bytes_total{name=~\"$container_name\"}[$interval])) by (name)",
"intervalFactor": 2,
"legendFormat": "{{name}}",
"range": true,
"refId": "A",
"step": 240
},
{
"datasource": {
"type": "prometheus",
"uid": "mimir01"
},
"editorMode": "code",
"expr": "sum(rate(container_network_receive_bytes_total{name=~\".+\"}[$interval])) ",
"hide": false,
"intervalFactor": 2,
"legendFormat": "Total",
"range": true,
"refId": "B",
"step": 10
}
],
"title": "Received Network Traffic per Container",
"type": "timeseries"
},
{
"collapsed": false,
"gridPos": {
"h": 1,
"w": 24,
"x": 0,
"y": 42
},
"id": 46,
"panels": [],
"title": "Logs",
"type": "row"
},
{
"datasource": {
"type": "loki",
"uid": "loki01"
},
"fieldConfig": {
"defaults": {
"color": {
"mode": "thresholds"
},
"custom": {
"align": "auto",
"cellOptions": {
"type": "auto"
},
"filterable": true,
"inspect": false
},
"mappings": [],
"thresholds": {
"mode": "absolute",
"steps": [
{
"color": "green"
},
{
"color": "red",
"value": 80
}
]
}
},
"overrides": [
{
"matcher": {
"id": "byName",
"options": "Time"
},
"properties": [
{
"id": "custom.width",
"value": 232
}
]
},
{
"matcher": {
"id": "byName",
"options": "Line"
},
"properties": [
{
"id": "custom.width",
"value": 2037
}
]
},
{
"matcher": {
"id": "byName",
"options": "application"
},
"properties": [
{
"id": "custom.width",
"value": 104
}
]
},
{
"matcher": {
"id": "byName",
"options": "Host"
},
"properties": [
{
"id": "custom.width",
"value": 110
}
]
},
{
"matcher": {
"id": "byName",
"options": "container_id"
},
"properties": [
{
"id": "custom.width",
"value": 106
}
]
},
{
"matcher": {
"id": "byName",
"options": "Container"
},
"properties": [
{
"id": "custom.width",
"value": 170
}
]
}
]
},
"gridPos": {
"h": 16,
"w": 24,
"x": 0,
"y": 43
},
"id": 47,
"options": {
"cellHeight": "sm",
"footer": {
"countRows": false,
"fields": "",
"reducer": [
"sum"
],
"show": false
},
"showHeader": true,
"sortBy": []
},
"pluginVersion": "10.1.1",
"targets": [
{
"datasource": {
"type": "loki",
"uid": "loki01"
},
"editorMode": "builder",
"expr": "{container_name=~\"$container_name\", instance=~\"$instance\"}",
"queryType": "range",
"refId": "A"
}
],
"title": "Panel Title",
"transformations": [
{
"id": "sortBy",
"options": {
"fields": {},
"sort": [
{
"desc": true,
"field": "id"
}
]
}
},
{
"id": "extractFields",
"options": {
"format": "json",
"source": "labels"
}
},
{
"id": "organize",
"options": {
"excludeByName": {
"container_id": true,
"container_ip": true,
"id": true,
"labels": true,
"tsNs": true
},
"includeByName": {},
"indexByName": {
"Line": 5,
"Time": 1,
"application": 3,
"container_id": 6,
"container_name": 4,
"id": 0,
"instance": 2,
"labels": 8,
"traceID": 9,
"tsNs": 7
},
"renameByName": {
"Line": "Message",
"Time": "TS",
"application": "App",
"container_name": "Container",
"id": "id",
"instance": "Host"
}
}
}
],
"type": "table"
}
],
"refresh": "5s",
"schemaVersion": 39,
"tags": [],
"templating": {
"list": [
{
"allValue": ".+",
"current": {},
"datasource": {
"type": "prometheus",
"uid": "mimir01"
},
"definition": "label_values(container_cpu_load_average_10s,name)",
"hide": 0,
"includeAll": true,
"label": "Container",
"multi": true,
"name": "container_name",
"options": [],
"query": {
"qryType": 1,
"query": "label_values(container_cpu_load_average_10s,name)",
"refId": "PrometheusVariableQueryEditor-VariableQuery"
},
"refresh": 1,
"regex": "",
"skipUrlSync": false,
"sort": 0,
"type": "query"
},
{
"auto": true,
"auto_count": 50,
"auto_min": "50s",
"current": {
"selected": false,
"text": "2m",
"value": "2m"
},
"hide": 0,
"includeAll": false,
"label": "Interval",
"multi": false,
"name": "interval",
"options": [
{
"selected": false,
"text": "auto",
"value": "$__auto_interval_interval"
},
{
"selected": false,
"text": "30s",
"value": "30s"
},
{
"selected": false,
"text": "1m",
"value": "1m"
},
{
"selected": true,
"text": "2m",
"value": "2m"
},
{
"selected": false,
"text": "3m",
"value": "3m"
},
{
"selected": false,
"text": "5m",
"value": "5m"
},
{
"selected": false,
"text": "7m",
"value": "7m"
},
{
"selected": false,
"text": "10m",
"value": "10m"
},
{
"selected": false,
"text": "30m",
"value": "30m"
},
{
"selected": false,
"text": "1h",
"value": "1h"
},
{
"selected": false,
"text": "6h",
"value": "6h"
},
{
"selected": false,
"text": "12h",
"value": "12h"
},
{
"selected": false,
"text": "1d",
"value": "1d"
},
{
"selected": false,
"text": "7d",
"value": "7d"
},
{
"selected": false,
"text": "14d",
"value": "14d"
},
{
"selected": false,
"text": "30d",
"value": "30d"
}
],
"query": "30s,1m,2m,3m,5m,7m,10m,30m,1h,6h,12h,1d,7d,14d,30d",
"queryValue": "",
"refresh": 2,
"skipUrlSync": false,
"type": "interval"
},
{
"allValue": ".*",
"current": {},
"datasource": {
"type": "prometheus",
"uid": "mimir01"
},
"definition": "label_values(instance)",
"hide": 0,
"includeAll": true,
"label": "Host",
"multi": false,
"name": "instance",
"options": [],
"query": {
"qryType": 1,
"query": "label_values(instance)",
"refId": "PrometheusVariableQueryEditor-VariableQuery"
},
"refresh": 1,
"regex": "/^(?!.*:[0-9]).*$/",
"skipUrlSync": false,
"sort": 1,
"type": "query"
}
]
},
"timepicker": {
"refresh_intervals": [
"5s",
"10s",
"30s",
"1m",
"5m",
"15m",
"30m",
"1h",
"2h",
"1d"
],
"time_options": [
"5m",
"15m",
"1h",
"6h",
"12h",
"24h",
"2d",
"7d",
"30d"
]
},
"timezone": "browser",
"title": "System and Containers Monitoring",
"uid": "cdoo9vjydc35sd",
"version": 14,
"weekStart": ""
}Grizzly
Installation
There are different ways to install Grizzly, one of the most simple ones is download the binary file and locate it in
/usr/local/bin path and set execution permissions.Grizzly repos at https://github.com/grafana/grizzly/
# dowloading the latest available, at post time is version 0.4.8
wget https://github.com/grafana/grizzly/releases/download/v0.4.8/grr-linux-amd64 -O /usr/local/bin/grr
chmod 755 /usr/local/bin/grr

# checking that it works
/usr/local/bin/grr --version

$ /usr/local/bin/grr --version
Providers: Grafana - active, Mimir - inactive (mimir address is not set), Synthetic Monitoring - inactive (neither access token nor stack configuration (stack id, metrics id, logs id, token) are set. One must be set)
2024/10/16 06:57:18 grr version v0.4.8
Set up the context
# get the list of current context
grr config get-contexts

# create our context, we'll call it: i40sys
grr config create-context i40sys

# switch to our new context: i40sys
grr config use-context i40sys

# configure the context
grr config set grafana.url https://grafana.i40sys.com
grr config set grafana.token WHATEVER
Get a Grafana service token
- Go to the Grafana UI and login as an admin
- Burger menu > Home > Administration > Users and access > Service accounts
- Click on button "Add service account" (blue top right button)
- Fill in the form and click "Create", whatever "Display name" you want and desired "Role". For exporting dashboards "Admin" is enough.
- Then click on button "Add service account token" (blue button)
- Set a "Display name" and define "Experition", if you want it's not required. When all is set, press "Generate token".
- Another pop-up will show with the token, copy it and save it in a safe place. There is no way to see it again.
Getting resources from the current context
# getting everything, i40sys is the path where files will be saved
grr pull i40sys

# only dashboards
grr pull i40sys -t "Dashboard/*"

# dashboards, data sources and folders
grr pull i40sys -t "Dashboard/*" -t "Datasource/*" -t "Folder/*"

# concrete dashboard and data sources
grr pull i40sys -t "Dashboard/UID" -t "Datasource/UID"
Provisioning resources to Grafana using Grizzly current context
# i40sys, is the folder where we pulled the resources previously
# next command provision all the resources that we have in the folder
grr apply i40sys

# Only the datasources
grr apply -t "Datasource/*"
Sample output:
Applying 4 resources
Datasource.loki01 added
Datasource.mimir01 added
DashboardFolder.ee0wylea3v3swe added
Dashboard.cdoo9vjydc35sd added
4 resources added
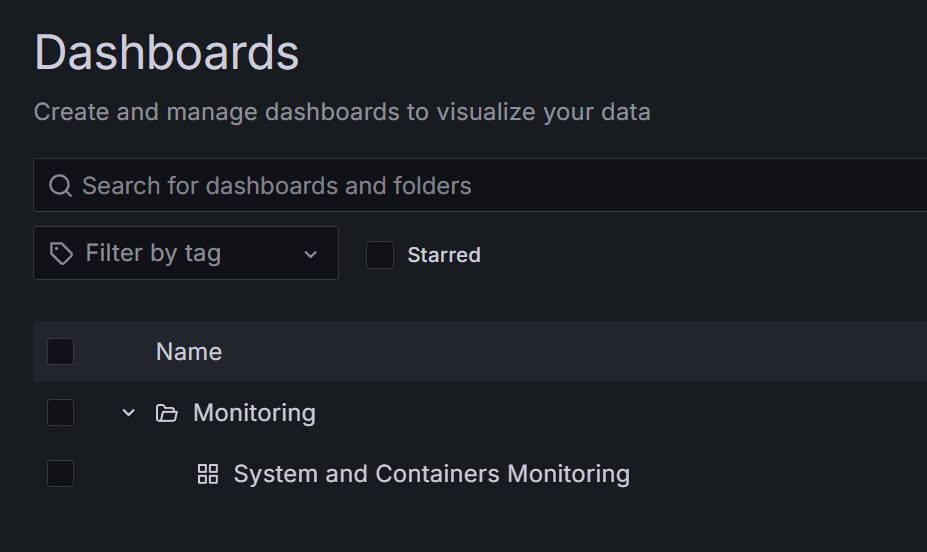
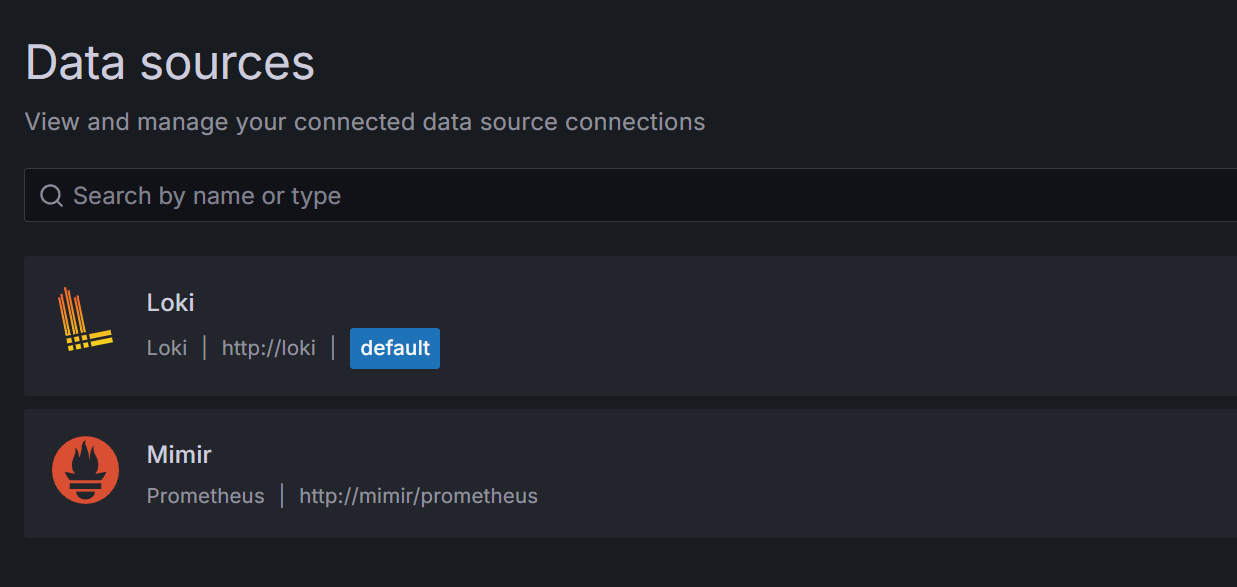
In the UI, dashboards and data sources:
Before
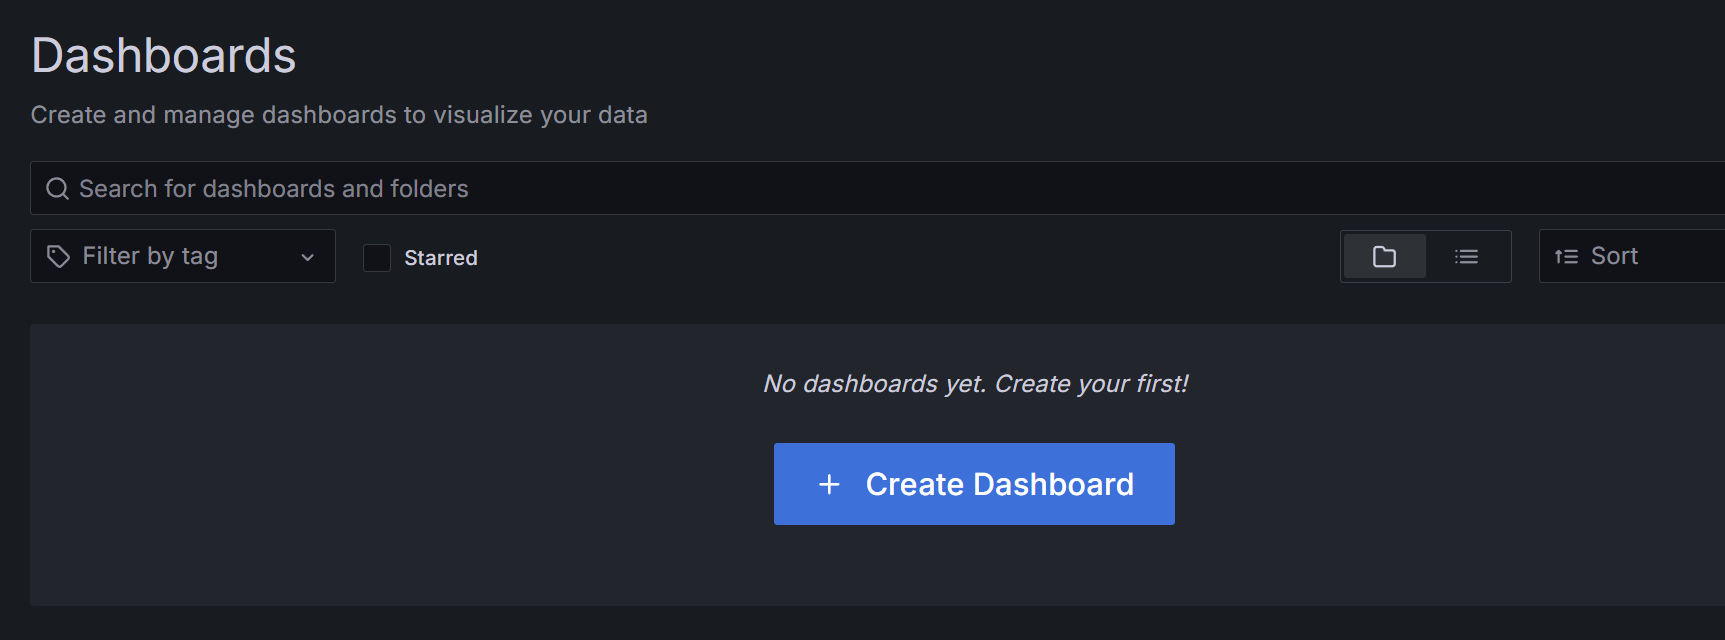
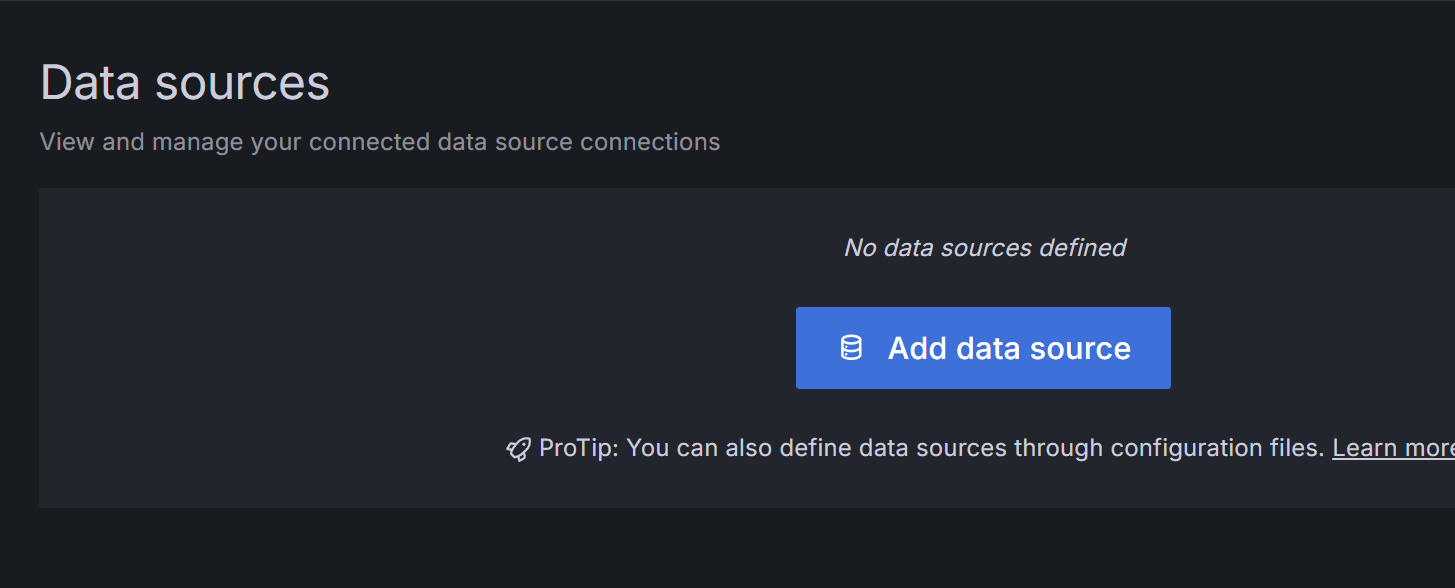
After
Dashboard as a code
You can use many different techniques for creating your dashboards as code. One of the most famous ones is grafonnet (based on Jsonnet). Anyway, when you have a pulled dashboard you can run Grizzly as a server and debbug in local how the dashboard looks like.
# getting current resources
grr pull i40sys
# run the local Grafana server
grr serve i40sys
# the open the browser using next URL
http://localhost:8080

# if you want to autoreload when a change is done
grr serve -w i40sys
Provisioning con Ansible
Para provisionar los data sources y los dashboard de Grafana usaremos una colección de roles que nos van a facilitar mucho la vida:  Community.Grafana — Ansible Community Documentation
Para que te quedo todo bien documentado y con un buen ejemplo para usar, te lo hemos dejado en este repositorio de GitHub: ansible-grafana-provisioning
Referencias
 Provision dashboards and data sources | Grafana Labs
- Provision Grafana | Grafana documentation
- Configure Grafana | Grafana documentation
- HTTP API examples | Grafana documentation
 Grafana Grizzly Docs - A Command Line utility for managing Grafana Resources
- hamara Export datasource from the existing Grafana DB into a YAML provisioning file
- grafana-ansible-collection Ansible collection provides modules and roles for managing various resources on Grafana Cloud and roles to manage and deploy Grafana Agent and Grafana
- Provisioning in Grafana | Volkov Labs
 Controller runtime dashboard - Grafonnet